


Are You Investing Based on Conventional Financial Planning’s Advice?
If so, you’ve likely fallen prey to Wall Street’s carefully honed bait and switch. Conventional advice, whether coming from a financial advisor, running conventional financial planning software, or using AI that mimics conventional planning (CP) software, starts with a seemingly straightforward question.
Here’s that question (in bold) in a hypothetical Q&A between a conventional planner, a CP software program, or an AI doing CP. Note the bait — a generally far too high spending target — and the switch — calling the target “your target.”
Wall Street’s Bait and Switch
How much do you want to spend in retirement?
A billion dollars a year.
Ha ha! Yes, we all need help setting our retirement-spending target.
I’ll say. There are so many factors to consider. And I can only spend what I can afford.
No worries. Let’s use the tried and true industry’s rule — 80% of pre-retirement income.
Well, that would be a dream come true. It’s what we’ve been praying we could spend.
Gee, given your saving and investments, your chance of making your target is only 35%.
But, no worries, we can invest your money and raise the probability to 85% after our 1% fee.
Wow! Great! Sign us up!
Going from 35% to 85% — Jacking Up Risk Without Disclosure
As everyone knows, stocks generate a much higher real return, on average, than safer assets, like bonds. They do so for a reason. Stocks comes with huge risk. On average, in a given year, the real yield on the S&P is 20 percentage points higher or lower than its 7% mean. No surprise then that CP’s method of meeting “your” retirement-spending target is to invest a much higher share of your assets in stock.
Upping your investment risk raises your probability, your *average *chance, of being able to spend, throughout retirement at “your” spending target. But it also raises your probability — your *average *chance — of *early *financial destitution — losing all your assets soon after retirement. Stated differently, it raises the average length of financial destitutions when they occur.
Wall Streets shouts about your high probability of winning at retirement poker. But it fails to even whisper about your probability of losing your shirt. Here, as elsewhere, there is no free lunch. More risk means more risk. You just need to see where Wall Street is hiding it.
Conventional Planning’s Hidden Tricks to Make Risky Investing Look Good
“Figures lie and liars figure.” This was the pet expression of John Mitchell, Richard Nixon’s Attorney General. Mitchell knew a good deal about lying. He served 19 months in prison for committing perjury during the Watergate hearings.
Trick 1
The first trick is that just mentioned — focusing on the chance of success and keeping mum about the chance of failure. This is malfeasance, pain and simple, but fully approved by FINRA — the Financial Industry Regulatory Authority. No economist in his right mind would say that going broke 15 percent of the time is safe or constitutes a sensible financial plan.
CP, to my knowledge, provides zero stats about 1) how riskier investing raises your chance of completely running out of money by, say, age 70, 2) the chance of having assets that are positive, yet dramatically lower than those at retirement well before your assumed expiration date, 3) the chance you’ll run out of assets after your assumed expiration date, but before your maximum age of life, 4) how far your living standard could drop if you run out of assets, 5) whether you’ll be forced to sell your home or downgrade your apartment 15% of the time, and 6) the list goes on.
Trick 2
If you’re like most people, you are investing cautiously because you aren’t a great saver and haven’t accumulated enough money to lose. Given this, your average simulated chance of spending, year after year in retirement, 80% of what is likely your peak annual income, will generally be quite low, e.g., 35%. Without nerding out on sequence of return risk, the higher “your” spending target the better risky investing will look compared to safe investing on CP’s success metric. But a higher spending target also means a higher, unreported likelihood of early loss of all or most of your assets.
Trick 3
Wall Street makes risky investing look better than it is by cherry picking the equity return series used in the Monte Carlo simulations determining the recommended investment strategy’s success probability. As discussed here, this cherry picking of return series was recently flagged by Wade Pfau, an outstanding economist and leading financial guru.
Trick 4
Wall Street doesn’t disclose what is surely a higher probability of CP success if you invest the same share of your assets in stocks as it advises, but do so on your own — at a .03% rather than a 1% fee — in, say, a fully diversified equity mutual fund.
Trick 5
Ignore the fact that no one in their right mind would keep spending at “their” target as their assets start going to hell. Instead, assume, as CP does, that you’ll spend at “your” targeted level, come hell or high water. This assumption also amps up the average chance of success while raising the undisclosed risk of early asset exhaustion.
If the above five tricks are making you queasy about your CP-based investment decisions, grab an emesis bag before reading on.
The Real Problem with CP’s Investment “Advice” — Ignoring Risk
The biggest problem with CP-based investment “advice” is that it ignores risk. This is why not a single top economics or finance department at any university anywhere in the world teaches CP’s method of determining optimal investment allocations. CP evaluates investment allocations based on a probability — the probability of spending at your target through your expiration date. But a probability, as I’ve hinted above, is an average. And risk is about the dispersion of outcomes, not about average outcomes. Let me clarify via a parable.
Suppose I meet you on the street and propose we have a stranger flip a quarter. If it comes up heads, you pay me $10,000. Tails I pay you $10,000.
Would you take the bet?
No!
Come on! On average, you’ll break even! Plus, your success probability is 50%! Let’s flip!
No!
Ok, let’s make it $1,000.
No!
$100.
No!
$10!
Get lost. You’re wasting my time.
The reason neither you, nor I, nor anyone for whom money matters won’t bet based on the average is simple. The downside, not the average is what we most care about. Losing $10,000 would reduce our utility (our happiness) far more than winning $10,000 would raise it. Economists call this risk aversion.
Risk aversion was first modeled mathematically by Gabriel Cramer in 1728 and Daniel Bernoulli, in 1738. Both mathematicians helped formalize the concept of utility (happiness), specifically the relationship between happiness and money (consumption). Utility, they postulated, goes up with consumption, but at a decreasing rate. The smaller and smaller additions to happiness from consuming more and more at a point in time is called diminishing marginal utility. This property is not a matter of math. It’s a matter of physiology, specifically the fact that we get satiated.
Suppose you’re a steak lover and have waited all month to have a juicy ribeye at a fancy restaurant called Here’s the Beef. You’re starving. But when you get to the restaurant, you learn, to your horror, that they just sold out of ribeye. Even worse, you learn they’ve run out of steak entirely. But, hey, they do have tender liver steaks.
You are now extremely unhappy as just the smell of liver makes you reach for an emesis bag.
Consider a parallel universe in which the restaurant has plenty of ribeye. You order, you eat, you smile, and then the waiter tells you the next one is on the house. You go for it. Then the waiter puts yet another big boy on your plate — a third 24 oz. steak. But it’s free! With every extra bite, you smile to your friends while turning a deeper shade of green. After spending an hour downing the third steak, the waiter plops a fourth massive artery clogger on your plate.
You take one look, go full virid, and start crawling to the gents.
That’s risk aversion — diminishing additional happiness from consuming more and more at given point in time. (Actually, my example involves utility declining, not rising even a bit, at the sight of steak #4, but I couldn’t resist!) Risk aversion is why we save for retirement, when we’d otherwise have no steak, why we buy catastrophic insurance, when the loss of, say, our house would mean no steak, and why we diversify our portfolios, when, say, a stock crash, would mean eating cans of Fancy Feast beef and liver, not steak.
Nobody wants to splurge today and starve tomorrow or vice versa. And no one wants to splurge under this circumstance and starve under that circumstance or do the opposite. Consumption smoothing — equalizing, if not necessarily perfectly, our steaks across time and situations — underlies all of economics-based personal finance, from saving for retirement, to purchasing insurance, to diversifying investments.
Risk Is About Dispersion. CP Is About an Average
A probability is an average. If I flip a fair coin, the probability it comes up heads is 50%. I can measure this probability by flipping the coin repeatedly. I’ll count 1 each time it comes up heads and zero otherwise. The sum of the counts divided by the number of flips is an average of the counts. It’s the share that are heads, which gets closer to one half the larger the number of counts (flips) that I’m averaging.
Hence, when CP talks about your probability of making “your” spending (consumption) target, it’s talking about an average. Optimal portfolio choice as developed by the fathers of finance, including five Nobel Laureates — Markowitz, Tobin, Sharpe, Samuelson, and Merton — is all about the dispersion of consumption, not its average value. Hence, when CP says you can spend “your” targeted amount 85% of the time, it’s telling you nothing about the dispersion of your spending. In particular, it’s not telling you what your spending will be the other 15% of the time. Revealing this information would spoil its con job. But it still wouldn’t bear any connection whatsoever to proper economics-based optimal portfolio choice.
Economics-Based Optimal Portfolio Choice
Economics’ approach to determining your optimal investment strategy is day and night different from CP’s. To see how it works, let’s suppose you invest just in stock. If you start earning high returns, you’ll naturally increase your spending to some degree. And if you start making losses, you’ll do the opposite. Thus, CP’s notion that you’ll put your spending on autopilot is at full odds with elementary finance and common sense.
Each year’s spending produces a certain amount of utility based on a simple mathematical formula — a utility function — that connects utility to spending. The shape of economists’ standard utility function — its rate of diminishing marginal utility — depends on a coefficient called the degree of risk aversion. People with higher risk aversion coefficients get satiated faster than others.
Suppose we plug your degree of risk aversion into the standard utility function. Then each path of stock returns you might earn in the future will produce a path not just of annual spending, but also of annual utility.
Realized lifetime utility references the lifetime happiness you experience from a given future path of annual stock returns and, thus, annual spending. Roughly speaking, lifetime utility from a path of returns is the sum of annual utilities associated with that path of returns.
Investing in stock entails, of course, many possible future spending paths and levels of realized lifetime utility. The average of these is called expected lifetime utility. If you’re very risk averse, paths that have lots of great returns and permit substantial spending won’t increase your expected, i.e., average, lifetime utility very much. Intuitively, you start getting sick of steak. But paths that have lots of awful returns will lower your expected lifetime utility a lot.
Of course, holding just stocks is only one investment strategy. Another is holding stocks and bonds on an 80-20 basis, now and in every future year. A third strategy is a 80-20 stock-bond portfolio before retirement and a 20-80 portfolio after retirement.
Each investment strategy entails a different set of annual-return, annual-spending, and annual-utility paths. And each such path produces a realized level of lifetime utility. Simulate these paths and average the associated realized lifetime utility levels and, voila, you have a measure of the investment strategy’s expected lifetime utility. Determining your optimal investment strategy is then simply a matter of finding the strategy that produces the highest level of expected lifetime utility.
Illustrating Economics-Based Optimal Portfolio Choice
My company’s MaxiFi Planner economics-based financial planning software is the only tool I know that helps you assess investment strategies based on maximizing expected lifetime utility. That’s unfortunate because everything I’ve told you so far may now come across as commercially biased. It’s not. It’s just the truth.
If there was another tool that did economics-based planning, I’d include it here. There’s not, for a reason. As the AIs will tell you, doing economics-based planning is extremely tough sledding, not something any current AI can get remotely right. MaxiFi is the result of 33 years of painstaking development. It’s incredibly complex and detailed under the hood, but easy as pie to run above the hood. Indeed, Bankrate named it “Best Financial Planning Software of 2025.”
All this said, let me illustrate optimal economics-based investment analysis for the case of Jim, a hypothetical 62-year-old, single, retired Alaskan. Jim has a $1 million IRA and a $1 million brokerage account. He has no expenses apart from renting an apartment in Juneau for $1000 a month and paying federal taxes.
Jim’s currently investing in a ladder of TIPS (Treasury Inflation Indexed Securities). Their maturity weighted average real yield is 2.5%. Jim assumes inflation will equal, long term, what the market now predicts, namely 2.25%. Finally, Jim is taking his $29,137 Social Security retirement benefit this month when he turns 62 and a half.
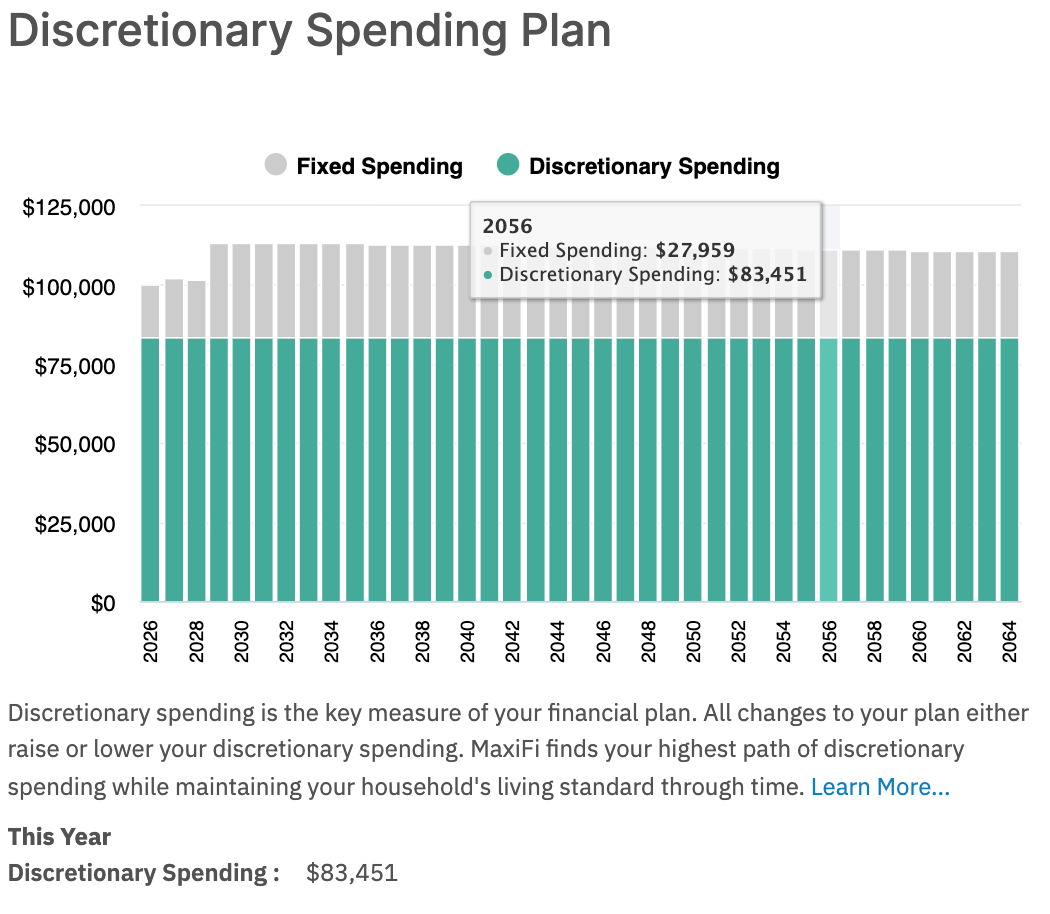
The chart below shows Jim’s sustainable discretionary spending, namely $83,451 in today’s dollars straight through Jim’s maximum age of death of 100. Discretionary spending is all spending apart from Jim’s fixed spending on housing and taxes.
Jim sleeps well at night knowing he’s investing as safely as possible. But during the day, he frets that he should, like everyone he knows, be investing in stock and regular bonds? Jim decides to explore risky investing using MaxiFi’s Full Risk Investing module. When Jim runs the module, he’s asked about this current investment strategy. He’s also asked to enter safe and risky investment alternatives.
Jim creates an asset called TIPS with a real return history of 2.5% each year for the last 25. He tells MaxiFi that he’s currently investing 100% of his retirement and regular assets in TIPS. Jim sets his safe strategy at 20-80 stocks-bonds and his risky strategy at 80-20 stocks-bonds. (MaxiFi entertains time-varying allocations as well.)
When Jim activates Upside Investing, MaxiFi simulates 500 return paths for Jim’s TIPS strategy, 500 for his 20-80 safe strategy, and 500 for his 80-20 risky strategy. In these simulations, MaxiFi assumes Jim will adjust his spending each year in light of that year’s market performance, but do so cautiously.
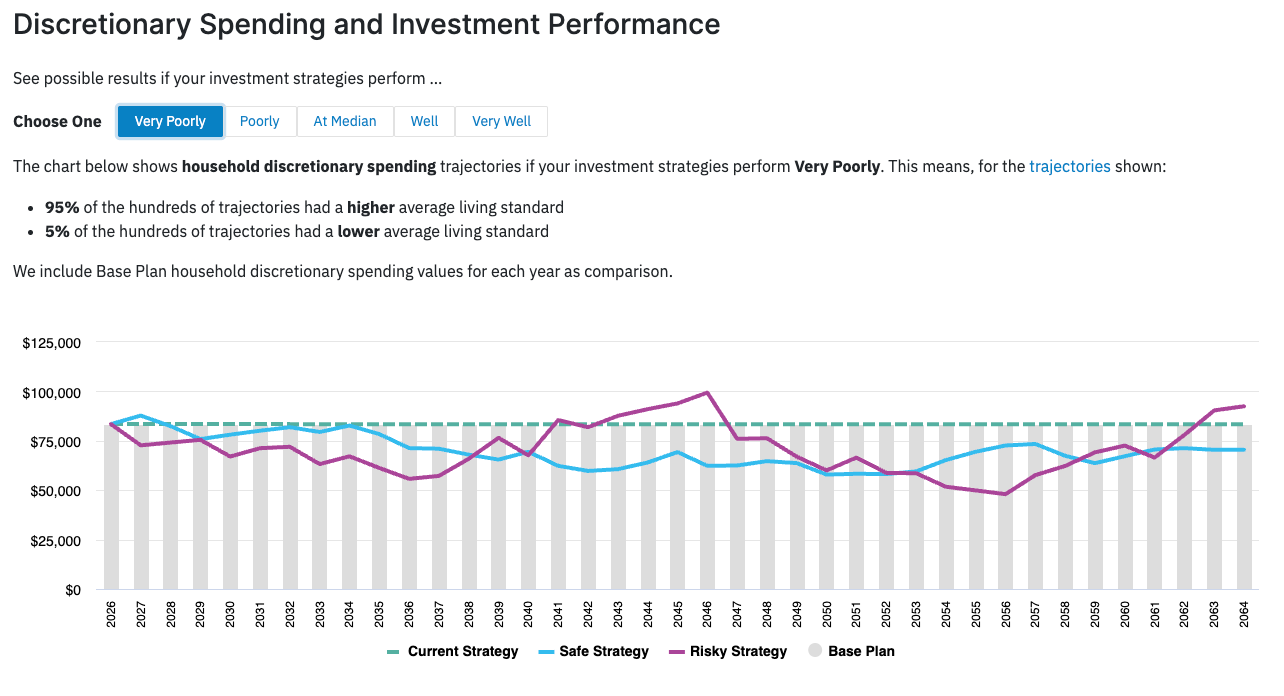
The chart below shows three 5th-best discretionary spending paths. Take the risky-investing red curve. It’s the curve whose average annual discretionary spending is the 5th highest (95th lowest) of the 500 simulated discretionary spending paths. The blue curve shows the 5th best (95th worst) discretionary spending path were Jim to invest safely. And the green dotted line shows Jim’s discretionary spending path if he simply holds his TIPS ladder. As we’d expect, the discretionary spending along the green dotted line is the same as in the top chart.
Clearly, the TIPS investment strategy looks very good in the chart right below, which focuses on very poor investment returns. Jim’s discretionary spending from investing in TIPS is almost always higher compared to following the risky or “safe” strategies. Indeed, as the chart makes clear, calling something safe doesn’t make it safe.
The next chart shows the three 95th best discretionary spending curves. As expected, the dotted green curve/line doesn’t budge. In addition, discretionary spending is higher in all years under the safe strategy and far higher, down the road, under the risky strategy.
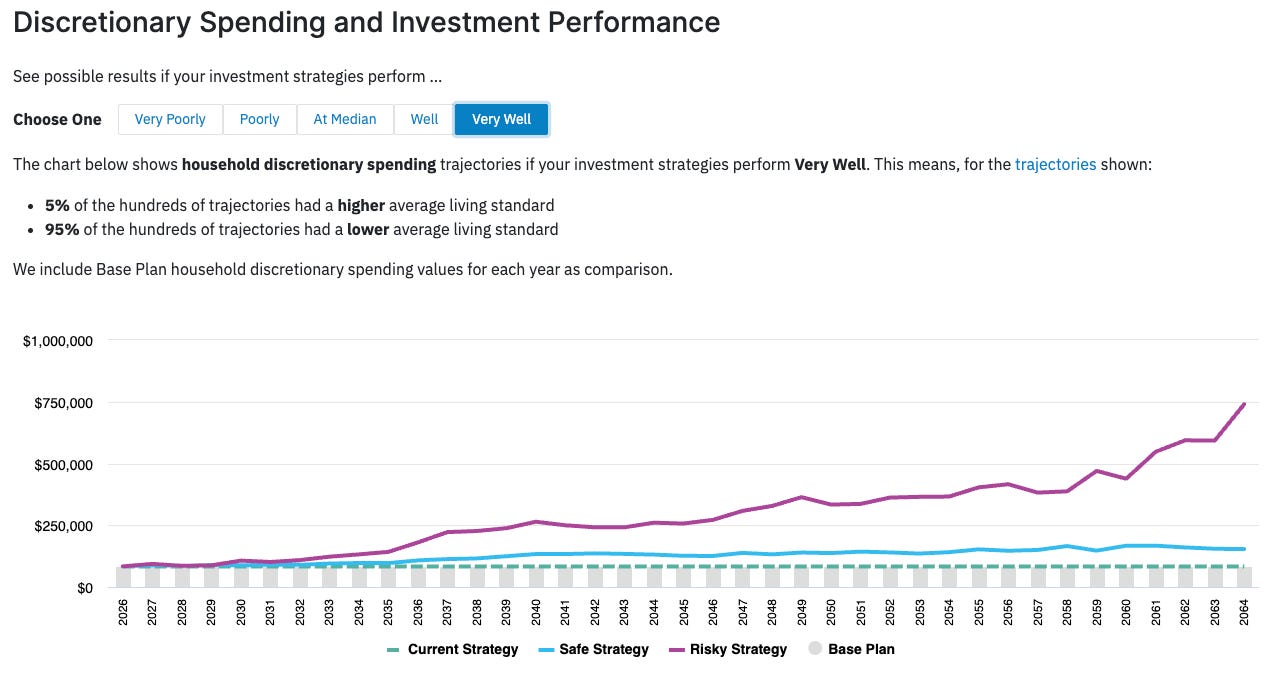
The message of the above two curves is that if you are investing at risk you don’t keep your spending fixed through time — no sentient person would do that. You adjust it annually based on how well your investments perform.
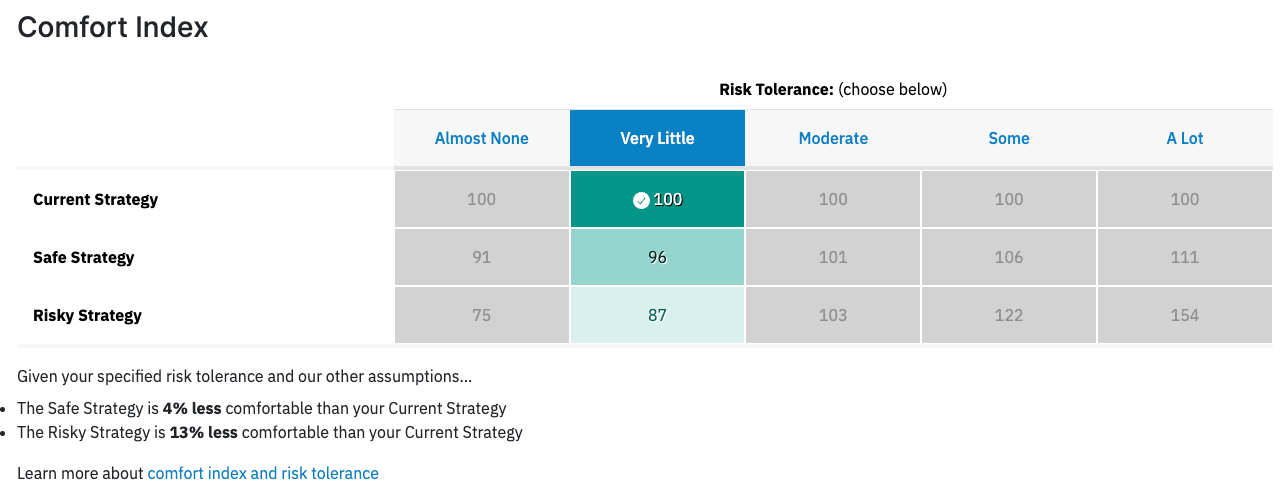
The final chart shows MaxiFi’s Comfort Index. We used to call it the Expected Utility Index, but changed the name to something less geeky. On a scale of 1 to 9, where 1 is “I can tolerate a lot of risk.” and 9 is “I can tolerate almost no risk.”, Jim is a 7. He can tolerate very little risk. As the Comfort Index shows, Jim should stick with the TIPS ladder. Adopting the risky strategy would be 13% worse in the following sense. The risky strategy would deliver the same amount of average (expected) lifetime utility as Jim can expect from investing in TIPS, but having 13% of his spending confiscated each year. For Jim, the “safe” strategy is also worse than his maintaining his TIPS ladder. It’s just as bad as continuing to invest in TIPS but having 4% of his annual discretionary spending stolen ever year.
Finding Alpha
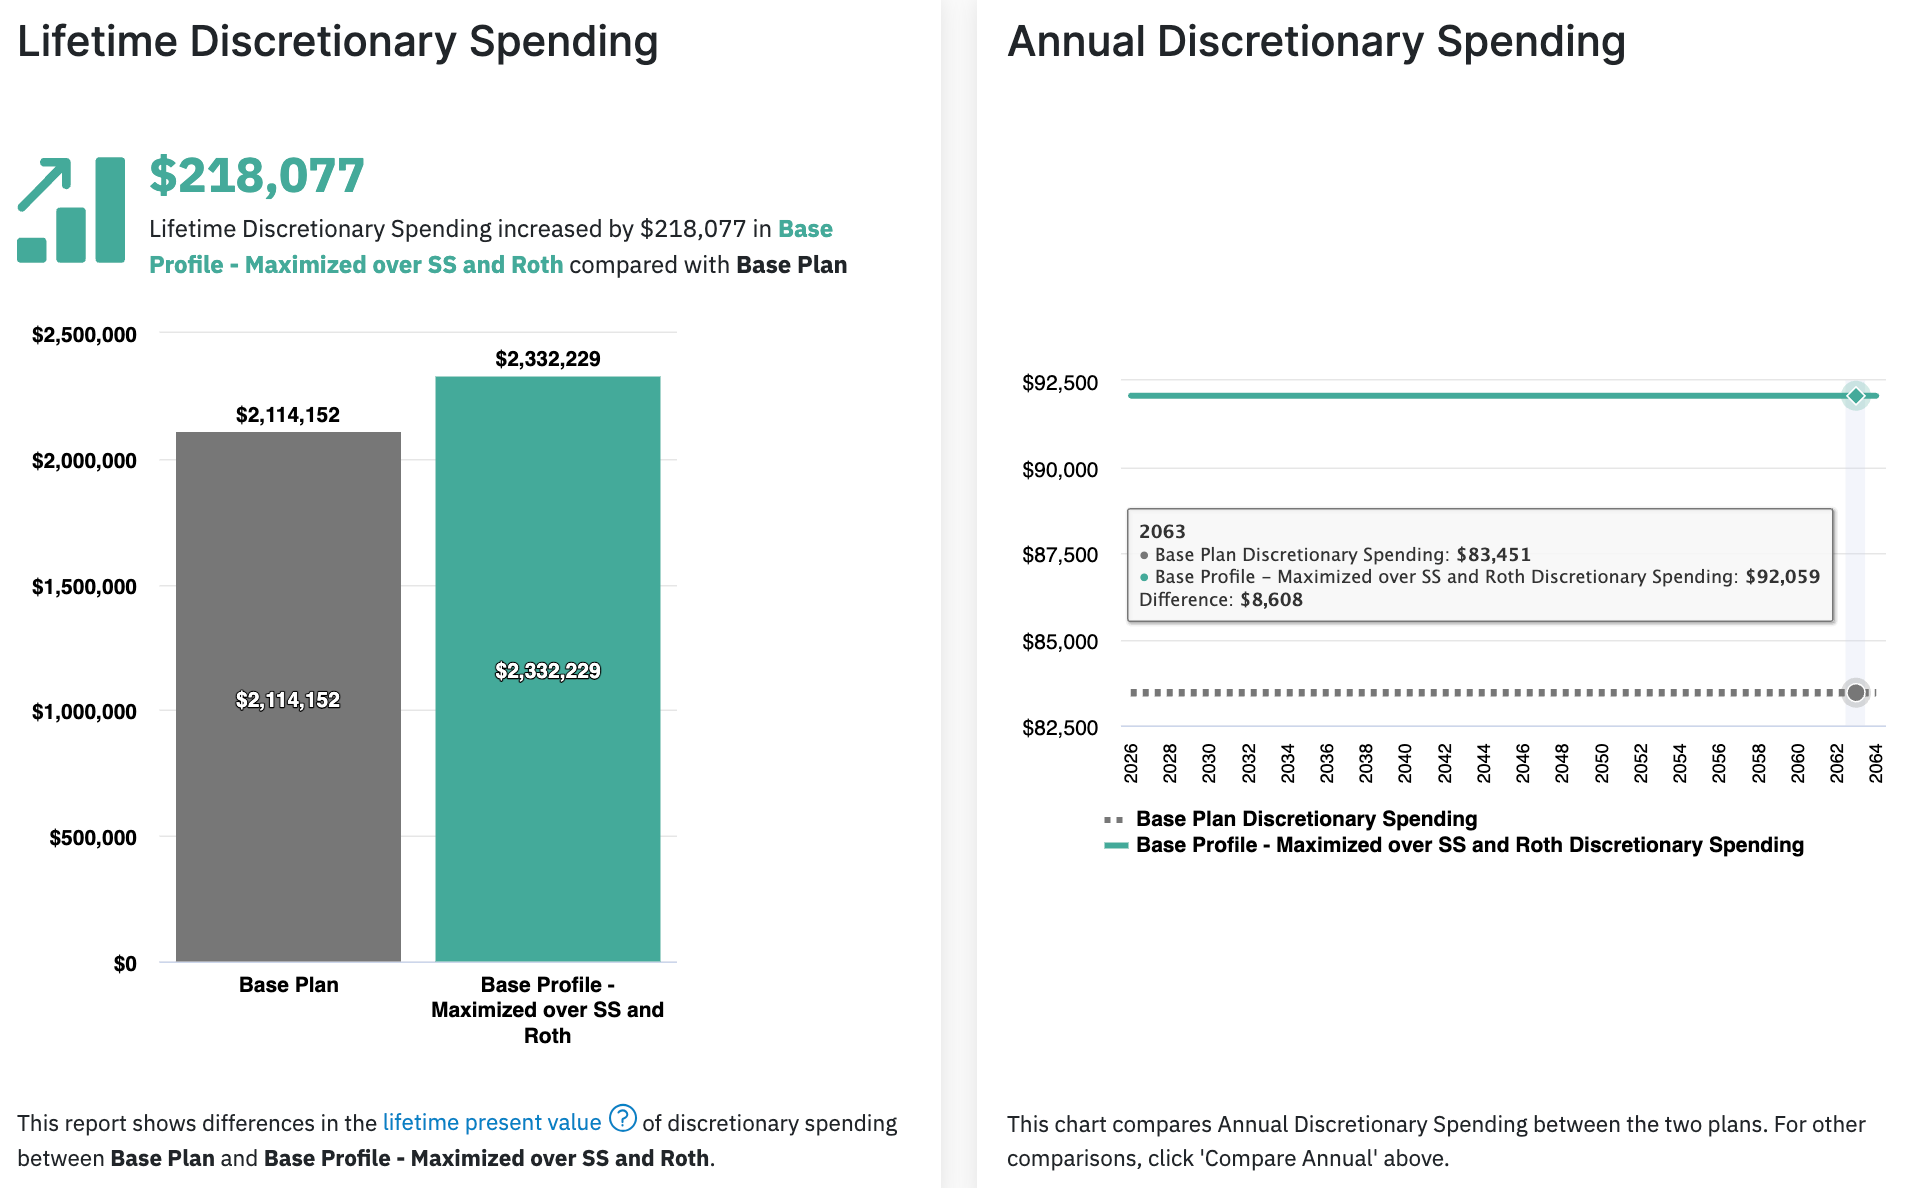
In the world of finance, alpha stands for earning a higher return for the same risk. Jim’s investment risk is zero. But as the next chart shows, MaxiFi can find him plenty of alpha. The chart compares his base plan with the same plan, but optimized over Jim’s Social Security benefit collection date and Roth conversions. The program found an extra $218,077 in lifetime (present value) discretionary spending that Jim can enjoy by taking Social Security at 70 and following MaxiFi’s suggested Roth conversion schedule.
Risky Investing is an Option, Not a Starting Point
CP is all about investing you at risk and charging a fee for “beating the market.” But we all can’t beat the market. Indeed, 90% of “expert” stock pickers underperform the market in a given year. There is nothing in economics that says playing it safe is wrong. This is why MaxiFi begins with safety-first planning and then lets users explore risky investing. Were Jim less risk averse — were he less concerned with the downside and more appreciative of the upside, risky investing would be his best move. So, my bottom line is make your investment decisions based on precisely understanding and properly assessing, based on your risk aversion, all the upside and downside living standard paths you may traverse.
Related: What a $200 Oil Shock Could Mean for Stocks, Bonds, Inflation, and Your Retirement
