


The S&P 500 just hit another all-time high.
That’s its 28th record high this year. For context, the market averages only about 17–18 record highs in an entire year. We’ve already blown well past that mark. And there are still three months to go.
By almost any measure, it’s been an exceptional year for stocks. So I asked my colleague Chris Wood what he makes of the market right now. And, more importantly, where he thinks we go from here.
I’ll share his answer in a second. But first, you need to know about…
The most misleading statistic in all of investing.
Some statistics, while technically correct, are wildly misleading.
Let me give you an example.
On January 22, 2006, one of the most memorable games in NBA history took place.
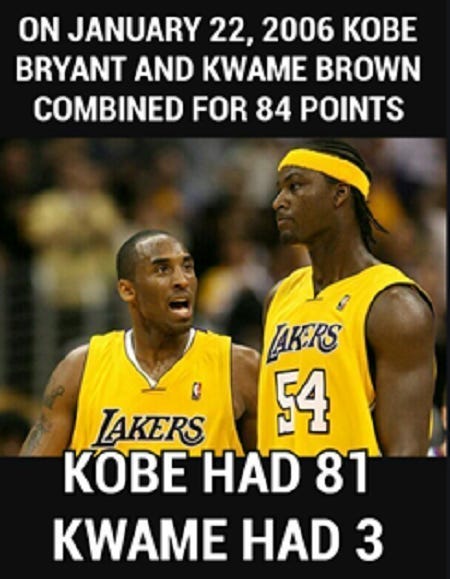
Legendary Lakers player Kobe Bryant and Kwame Brown combined to score 84 (!) points against the Toronto Raptors.
If you don’t follow the NBA, you may think both guys scored around 40 points.
Nope.
Kobe poured in a whopping 81 points… good for the second-highest total in NBA history.
Kwame scored 3.
Now, this is just a harmless example. It even became a popular “meme,” as you can see…
But when it comes to investing, getting the context wrong can cost you real money.
And with stocks hitting record highs again today, one statistic is especially worth revisiting:
“US stocks have risen 8% every year, on average, for the last 100 years.”
Technically true. Dangerously misleading.
Financial advisors like to use this stat to make you feel comfortable and secure…
They’d love for you to assume stocks have a clean, 100-year track record of consistently rising 8% a year… year in, year out.
That would be nice, wouldn’t it? If US stocks were predestined to keep rising 8%/year, on average, forever?
Of course… that’s not how markets work.
There are decades like the 1920s, ’50s, and ’90s when US stocks soared well over 200%… And there are decades like the ’30s and 2000s… when US stocks barely treaded water… and lost significant ground after factoring in inflation.
What about individual years?
Well, just look at what happened in 2022… one of the worst years ever for the markets. The S&P 500 fell nearly 20%.
2023 and 2024? Back-to-back 20%+ years…
And stocks rose another 18% last year.
This year, the S&P 500 has already climbed 14%. And it’s only October.
After a run like that, it’s tempting to think the good times must be coming to an end.
If stocks return around 8% a year over the long run, and we’ve just enjoyed several years of much bigger gains, doesn’t that mean some bad years must be right around the corner to bring us back toward the average?
Not necessarily.
That’s the problem with averages. They tell you what happened over a very long period. They tell you almost nothing about what’ll happen next.
It’s 100X more important to know:
What kind of stock market environment are we in today?
Are we in a time to be cautious like the 2000s… when investors should be playing defense? Or are we in a time of great opportunity, like the 1990s, when you should be getting aggressive?
That’s exactly what I asked Chris Wood. Here’s what he said:
“I think the big mistake investors keep making is underestimating how durable the AI megatrend is.
A lot of Wall Street is still incredibly short-term focused. Analysts are trying to predict the next quarter or the next year, while the companies driving the AI boom are laying out plans years in advance. And time and again, analysts have been surprised by how strong demand has remained.
You can see it in semiconductors and memory, where analysts talk about a potential supercycle but still build forecasts that assume the old boom-and-bust cycle eventually returns.
This is a rare time in history where the companies with the biggest wallets are telling you what they plan to do years in advance. And because the entire AI ecosystem depends on each piece of the supply chain keeping up, you have an unusual amount of visibility into where this investment is going.
That doesn’t mean stocks will go straight up.
In fact, I expect a lot of volatility over the next couple of years. We’ll probably keep seeing the same pattern we’ve already seen. The best AI names will get hammered whenever investors start worrying that the boom is ending. Then Nvidia, TSMC, or another major company will release numbers showing demand is still there, and suddenly everyone realizes the slowdown they were worried about hasn’t arrived.
That’s why I keep coming back to the same thing: Look behind the curtain. Look at the numbers. Follow what the companies are actually doing.
There are risks I’m watching. One of the biggest is how much money the hyperscalers are spending. By 2027 and 2028, some of them could become significantly cash-flow negative as they continue building out AI infrastructure. There’s also a lot more borrowing happening.
But spending enormous amounts of money during an upgrade cycle isn’t automatically a sign that something is broken. Amazon burned cash for years while building the infrastructure that eventually became AWS. What we’re seeing with AI is an upgrade cycle on a scale we’ve never really seen before.
So I’m not trying to predict exactly where the S&P 500 will be six months from now. That’s not how I invest. I’d rather look at individual companies and ask whether their businesses are getting stronger, whether demand is still growing, and whether the numbers support the story.
And right now, they do.
Things are moving so fast that traders will keep getting spooked by one thing or another. You’re going to get fits and starts like that.
But underneath all that volatility, the buildout is still happening.
For stock pickers, I think this is an amazing environment.”
Related: Could You Have Spotted Nvidia Before Its 1,400% Rise? Look for These 5 Traits
